DATA VISUALIZATION COURSE EXPLORES VISUAL APPROACHES TO PROBLEM-SOLVING
Image
Image
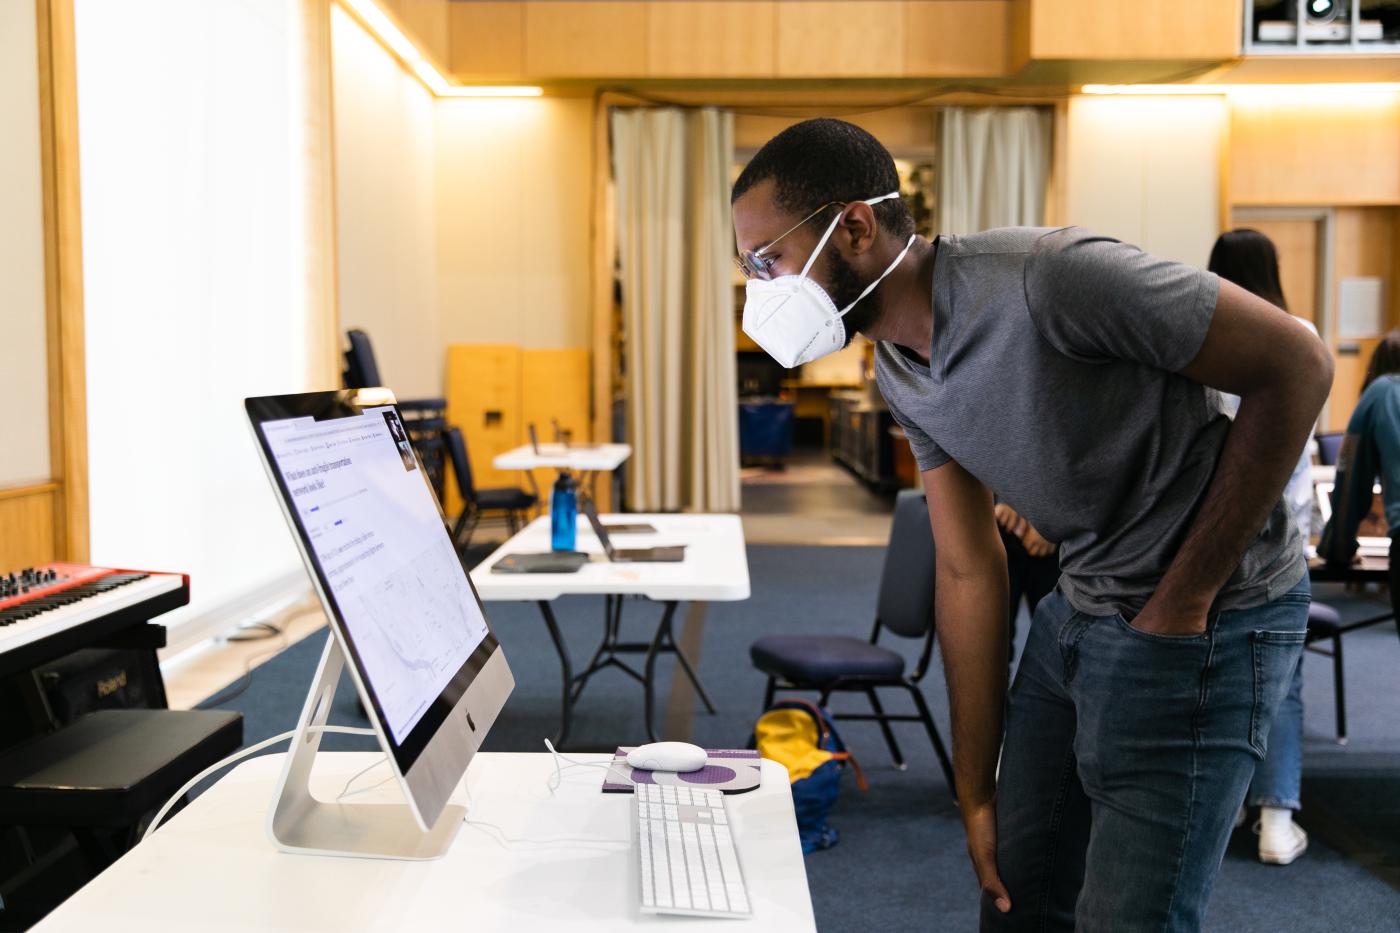
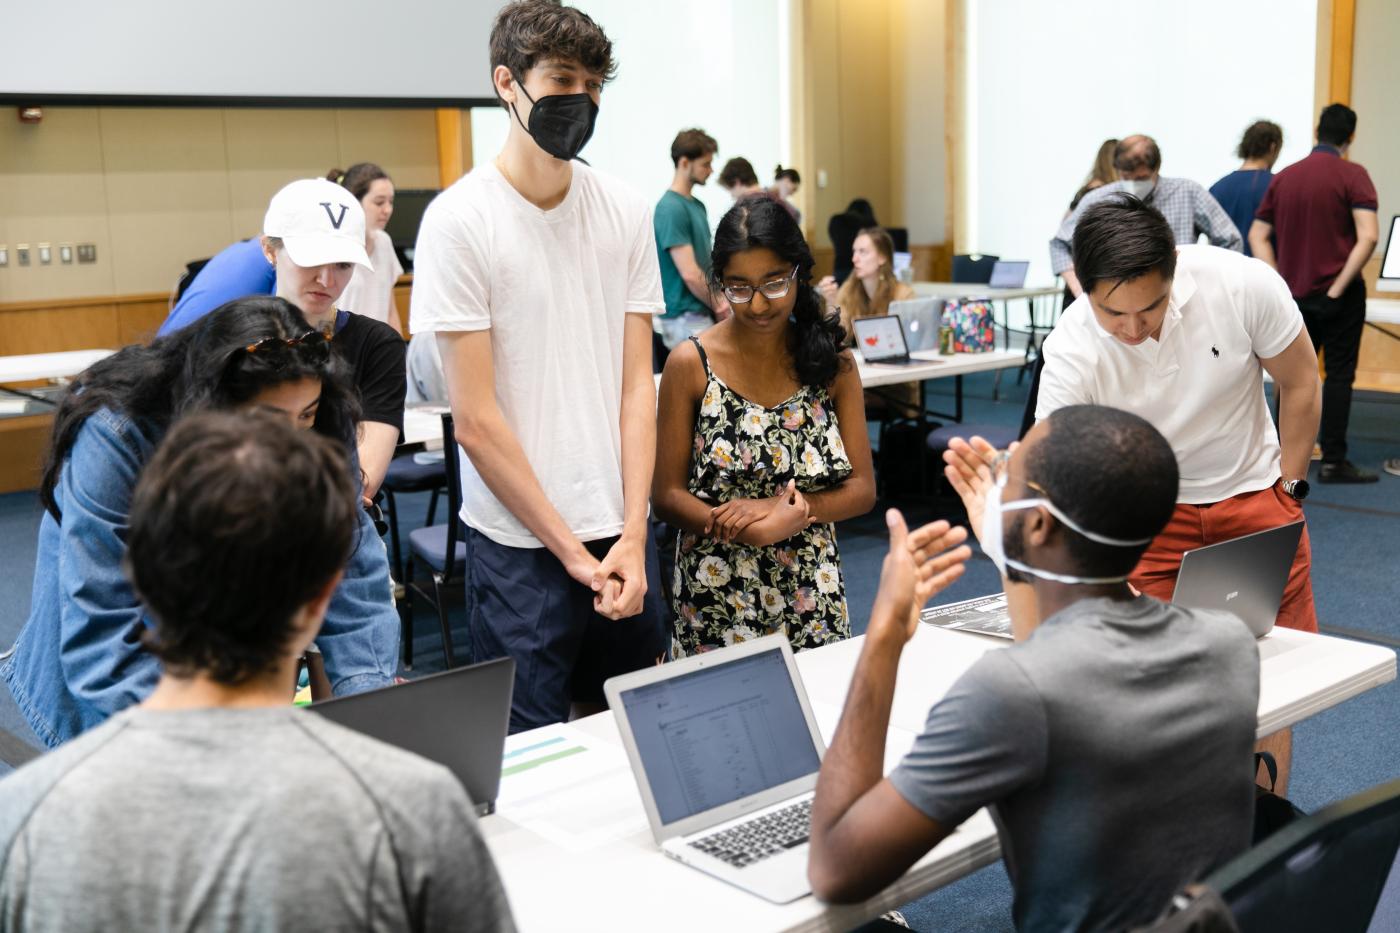
Taught by Lecturer Eric Field, Director of Information Technology for the UVA School of Architecture, SARC 5400 - Data Visualization, is a course that engages students across Grounds to explore visual approaches and precedents to problem-solving. This spring 2022 semester, the class which is supported by the School of Data Science brought together 90 students from six schools and 19 departments across the university and a full range of students - from undergraduate to graduates and PhD students studying architecture, urban planning, data science, engineering, public policy, computer science, global studies, biology, economics, statistics, cognitive science, psychology and more.
Each year, the course explores a single-word prompt that serves as a starting point for students to develop topics of individual interest, often related to their capstone or thesis work. In the past topics have included: Water, Public Health, Climate, Elections, Dissent, Mobility, Viral, and (in)Tolerance. This semester the topic was 'Fragile' — a theme through which student built data-driven visualizations of their own design across diverse topics.
Image
Image
"At first, the two objects are discrete — each has its own form and identity, and exists in its own space. There are clearly two independent objects. Then as the two objects, usually two very like figures, are brought closer to one another, they begin to interact with one another in our eye visually. The space between them, and the interaction between them, at a point suggests something new — a third object — that is formed by the simple juxtaposition of the initial two, as the derivative construct of the two source objects. Such an interaction could be conceived as noise, or if read differently (or structured more precisely) as the construction of insight." - Josef Albers
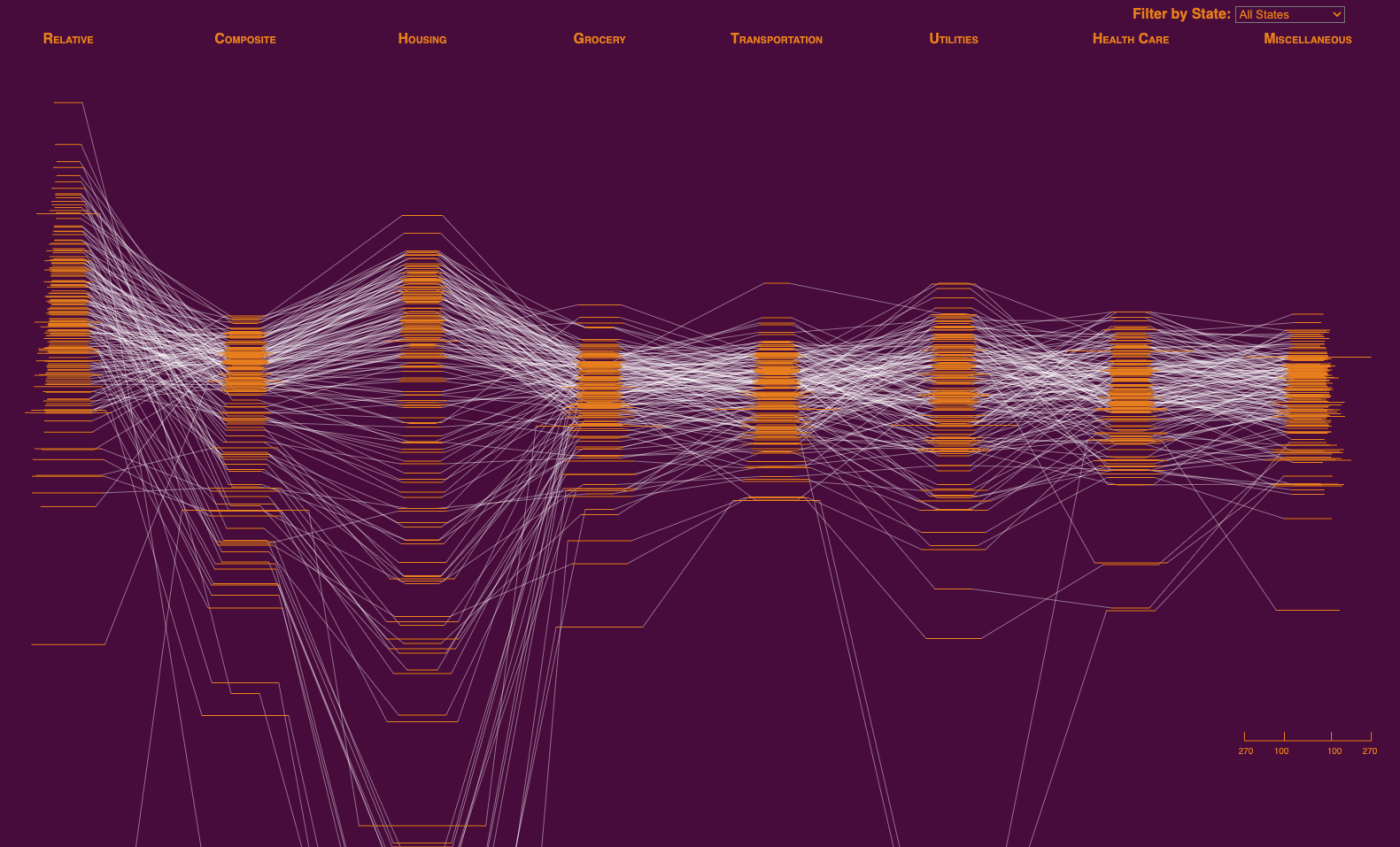
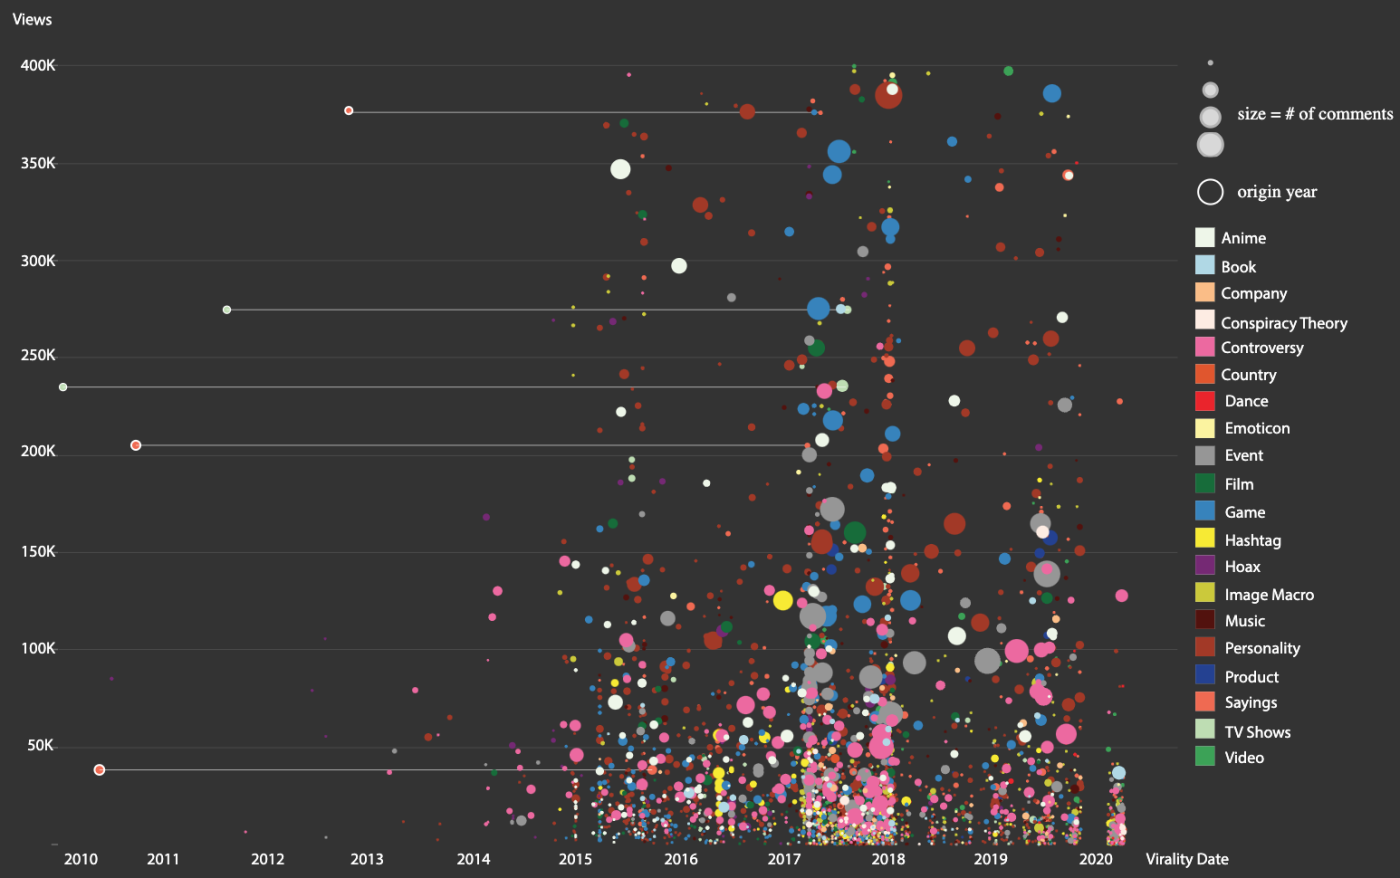
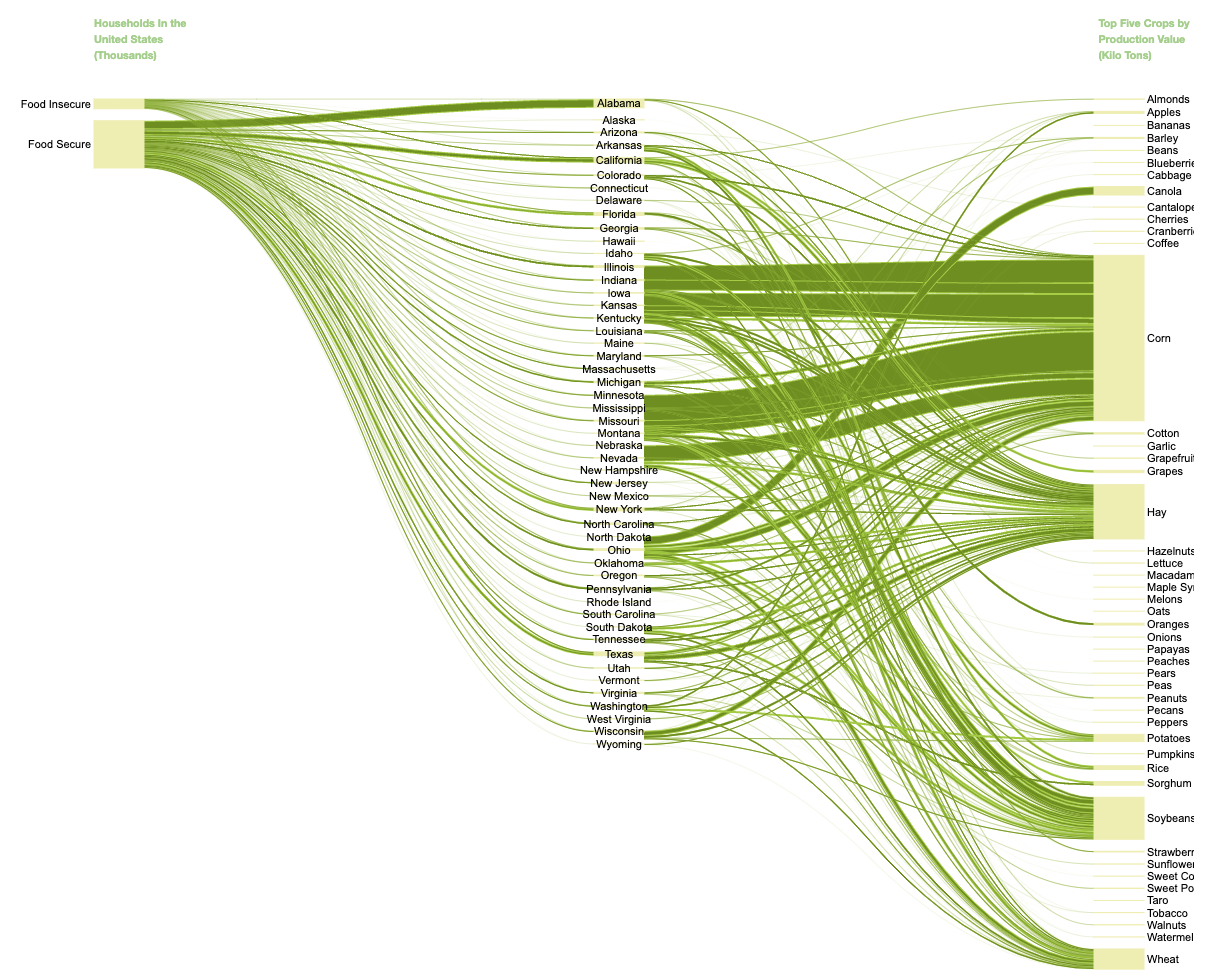
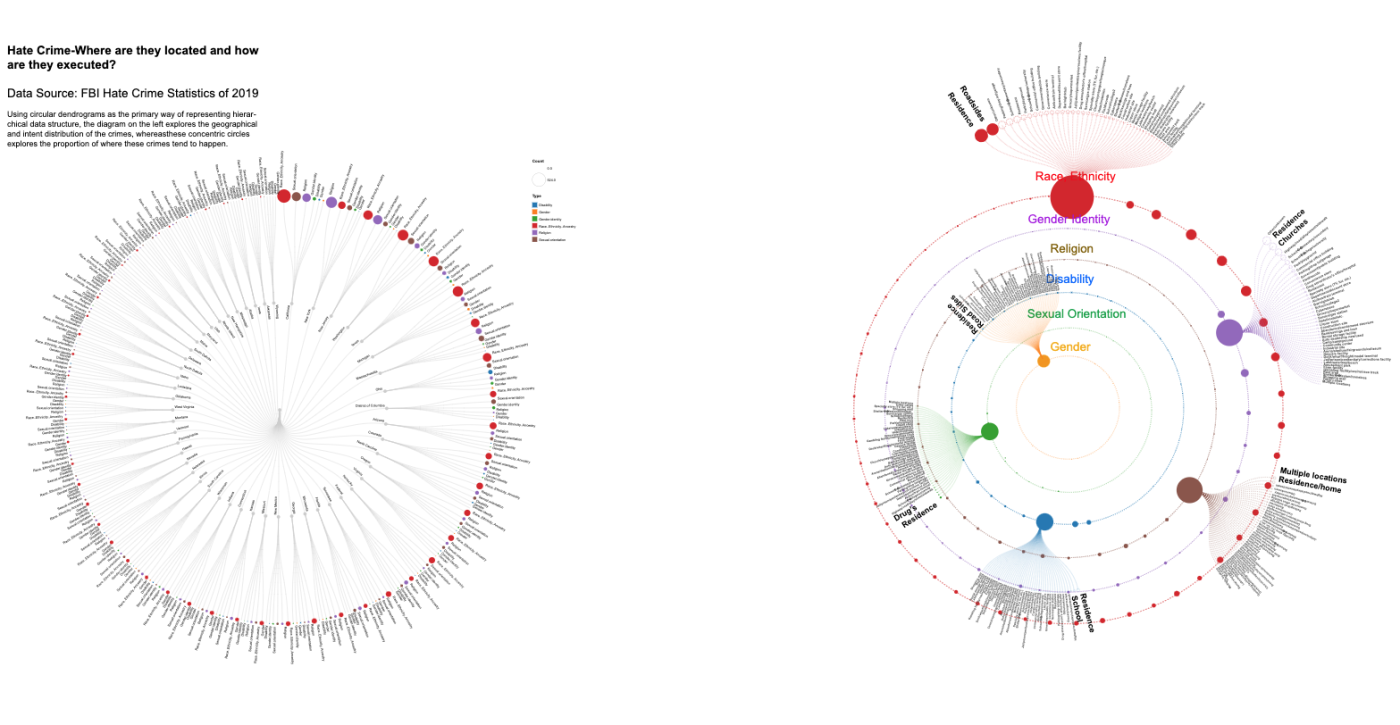
The HTML5 / SVG visualizations developed in SARC 5400 seek to harness this phenomenon described by the German artist Albers (1888-1976), but do so with data across complex problems facing our society.
Visit the course Archive site to learn more about the projects developed in this course.
Image
Image